Mirko Tobias Schäfer / Assistant Professor
University of Utrecht Department for Media and Culture Studies
Mirko Tobias Schäfer / Assistant Professor
University of Utrecht Department for Media and Culture Studies
On the initiative of R-Shief, a non-profit lab headed by VJ Um Amel, in Los Angeles, many hashtags referring to Occupy events around the world have been scraped from Twitter's public search API over the past months. In attempt to make sense of these 12 million tweets, R-Shief sent out an open invite to participate in a collective effort to 'play' with those data. Students from Utrecht's New Media & Digital Culture program were more than happy to team up with colleagues from MIT's Civic Media Lab in Cambridge, the R-Shief team in LA and a team from Zaragoza in Spain and other participants around the globe.
On IRC, Google docs, and U-stream, the various teams were discussing their activities. R-Shief organized on the fly tutorials and brief talks on various tools. The Utrecht team started early (due to their time zone) the hackathon by browsing through the data and preparing files for further use in visualization tools such as Gephi; later that day the MIT crew (Sasha Costanza-Chock, Pablo Rey, and Kawandeep) shared their extensive brainstorming on what could possibly done with those data. The ideas ranged from tracing the Pepperspraying Cop meme over social network analysis, comparative time lines and heat maps to content analysis concerning the URLs in the collected tweets.
The Utrecht team (Ryanne Turenhout, Thomas Boeschoten and Ruben Hazelaar) quickly decided to focus on a local agenda and isolated the hash tag #OccupyAmsterdam. The data set for #OccupyAmsterdam consists of 17.000 tweets sent between 16 October 2011 and 4 December 2011. The graph shows a steep decline in numbers of OccupyAmsterdam related tweets from over 2000 tweets on 16 October to 59 on December 4. The Occupy hashtags show in general a declining number of tweets sent. However, expecting a continuous flow of messages does not do justice to the media specific qualities of Twitter, which is a medium of the moment. This is clearly visible in the spikes of tweet distribution timelines. The amount of twitter messages and retweets seems related to events: When police arrested activists in Atlanta's Woodruff Park on October 26, the activity on Twitter jumped to more than 14.000 messages stating the #OccupyAtlanta hashtag. When special police units arrested 141 Occupy activists in Boston in the morning of 11 October, it sparked a Twitter activity of 48.000 messages sent with the hashtag #OccupyBoston. However, the notorious pepper spraying copper incident at UC Davis on 18 November did not result in immediate Twitter activity. On November 18th only 69 tweets used the hashtag #OccupyDavis. The next day 3.284 messages were sent referring to the incident of the previous day (See timeline hashtags by Thomas Boeschoten)
The OccupyAmsterdam data tell us that the languages used most are Dutch, English and Italian. 7690 were open tweets consisting of the hashtag #OccupyAmsterdam and were not retweeted by other users, 1925 messages were @replies to other messages and used the hashtag #OccupyAmsterdam and 7565 messages were retweets. We must note that whenever a tweet is retweeted, this tweet gets duplicated in the dataset, so a lot of the 7565 retweets are not unique but copies. A small number of accounts triggers the majority of retweets, while the messages of the majority of the #OccupyAmsterdam hashtag users are not retweeted to other users (See graph of most frequently retweeted accounts by Thomas Boeschoten). The official OccupyAmsterdam account (@OccupyAmsterdam) is most often retweeted with a modest number of 884 retweets combined for all messages sent from this account. @OccupyAdam counts 348 retweets followed by event manager @Kamillala (320 retweets) and singer @jajwouters (217 retweets).
Messages also refer to other Occupy venues through stating their respective hashtags. Most frequently mentioned are #OccupyDenHaag, #OWS, #Occupy and #OccupyNL. As typically for Twitter, a large number of URLs was sent through the OccupyAmsterdam Twitter-sphere. However, we were surprised to find the vast majority referring to www.occupyutrecht.nl. A large number of these tweets were actually requesting more followers for @OccupyUtrecht.
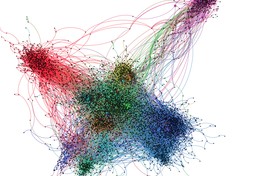
The general picture we gathered from the brief peek into the Dutch Occupy tweets is a limited communication of a rather small fragmented audience. An @reply-network visualization shows that a limited number of users is very active in communicating with each other frequently. Links to the international Occupy activities were limited and as far as we can learn from the brief and incomplete analysis so far, there is no concerted activities.
A surprising finding was when we checked the Twitter users of the OccupyAmsterdam hashtag with a sample consisting of Dutch members of parliament who are on Twitter and a selection of those accounts that are most frequently followed by them. The #OccupyAmsterdam hashtag has been also used by members of this specific sample. However, the overlap between this 'political establishment sphere' and the Occupy Twitter-sphere is marginal and accounting for less than 1% of all tweets in the OccupyAmsterdam hashtag. That might tell us that the #OccupyAmsterdam Twitter communication remains largely inside a fragmented audience.
The intense three day effort to analyse large amounts of data did not yet result in a comprehensive scholarly valid research. At best it led to results that provoke further research and help to formulate hypotheses. What we stated on the #OccupyAmsterdam Twitter sphere are are observations from a first glance at the data. We need more time for contextualisation and qualitative analysis of users and Tweets.
That does not mean that those three days were not fruitful. Rather, it was the opposite. On the analytical level the collective and purposefully unstructured approach led to a variety of methods used, approaches tested and results delivered. Many of them tentative and unfinished. Since we are dealing with fairly recent applications for data analysis and phenomena that are actually unfolding as we conduct our research, a playful and explorative approach makes sense. It also allows experimenting; it leaves space for making mistakes and to learn from them. The outcome of the hackathon are various data analysis and visualizations, among others: Ryanne Turenhout provided an attempt to map the network of 14 different hastags. The Boston team worked on tracking all media links inside the #OccupyBoston tweets. Others experimented with co-occurence mapping of keywords . Pablo Ray turned the massive photoshop art of a multitude of users into a large mosaic of Pepper Spraying Cop Seargant Pike.
In addition to the different research activities during these three days, the process of the hackathon itself proved to be extremely valuable. Working together online in overlapping time zones with equally motivated teams around the globe is an exciting experience. VJ Um Amel described is as an "Unprecedented Event" in a beautiful and very informative article.